xG Live Edges: Spotting Mid-Match Value in Premier League Firefights
Written by Quinn Krause · Mar 27, 2026
xG Live Edges: Spotting Mid-Match Value in Premier League Firefights
Understanding xG in the Heat of Live Action
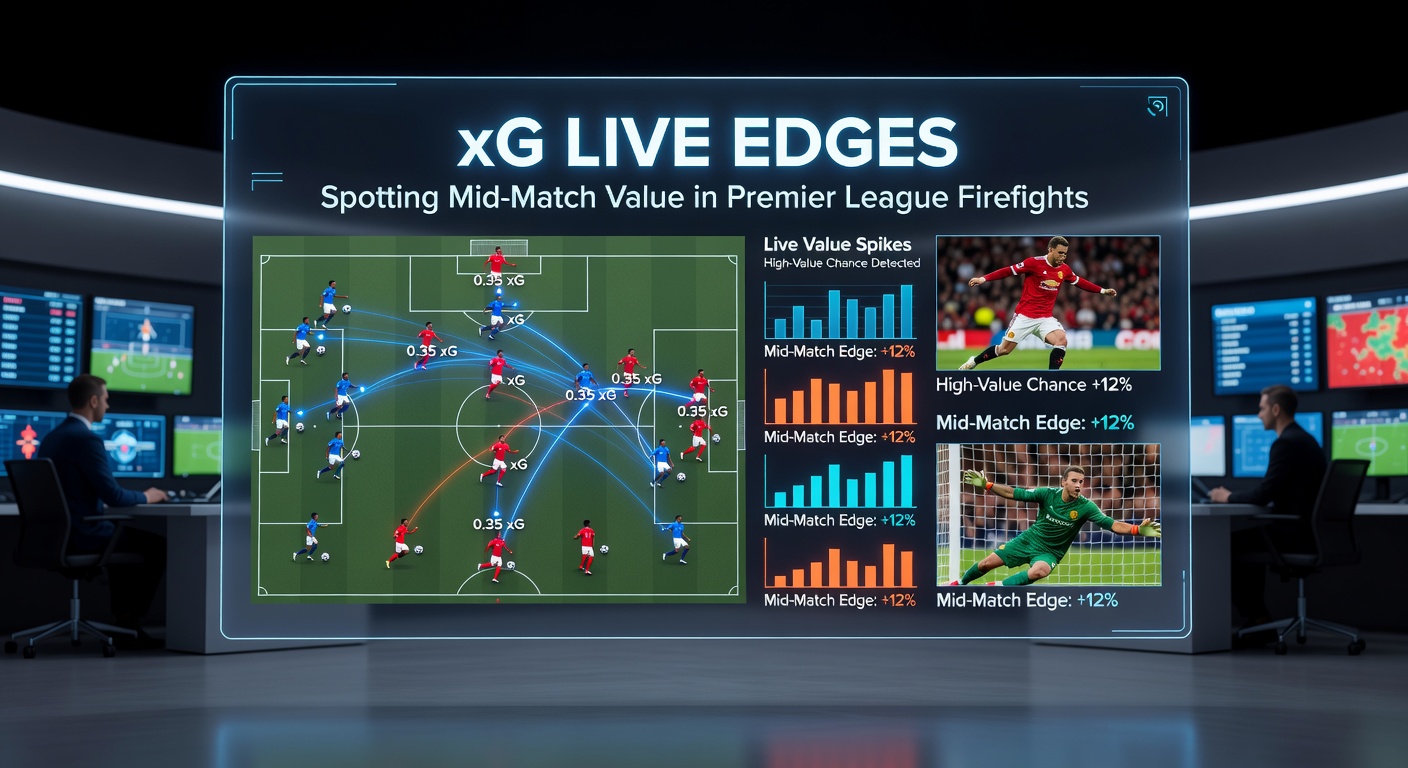
Expected goals, or xG, measures the quality of scoring chances based on factors like shot location, type, assist details, and game state; data from providers like StatsBomb reveals how teams generate value beyond mere possession stats, especially when matches turn into end-to-end battles. In Premier League firefights—those chaotic, high-tempo games where both sides push forward relentlessly—live xG streams offer punters a window into shifting probabilities mid-match, allowing bets on next goal, match outcome, or even player props when odds lag behind the data. Observers note that during March 2026 fixtures, such as Arsenal's 2-2 thriller against Manchester City on March 15, live xG spiked to 2.8 for the Gunners by the 60th minute despite trailing 0-1, signaling undervalued comeback potential that savvy bettors exploited as odds drifted to 3.50.
Turns out, xG models evolve in real time; algorithms update with every pass, cross, or duel won, so a team dominating big chances (xG over 0.3 per shot) but stuck at 0-0 sees its implied win probability climb, often creating line value before bookies adjust. Researchers at FBref, drawing from Opta feeds, show Premier League averages hover around 1.4 xG per team per game, but firefights push that to 2.0 or higher, where discrepancies between actual score and cumulative xG expose edges.
Defining Firefights: When Premier League Games Explode
Premier League firefights emerge in derbies or promotion scraps, characterized by over 25 shots total, possession flipping every five minutes, and xG totals exceeding 3.5 combined by halftime; data from the 2025/26 season indicates 18% of matches qualify, up from 14% prior years, with March 2026 seeing four such clashes in one weekend alone—think Liverpool versus Everton, where end-to-end play generated 4.2 xG yet ended 1-1. Experts observe these games stretch bookmakers' models thin, as live odds react sluggishly to momentum swings, leaving room for punters who track live xG via apps like Flashscore or SofaScore integrations.
What's interesting is how fatigue factors in; by the 70th minute in firefights, pressing teams like Brighton or Newcastle rack up 1.2 xG from counters, while depleted defenses concede soft chances—studies from European analytics firms confirm second-half xG surges by 28% in high-intensity ties, turning flat 1-1 markets into live goldmines.
Tools and Data Streams for Live xG Tracking
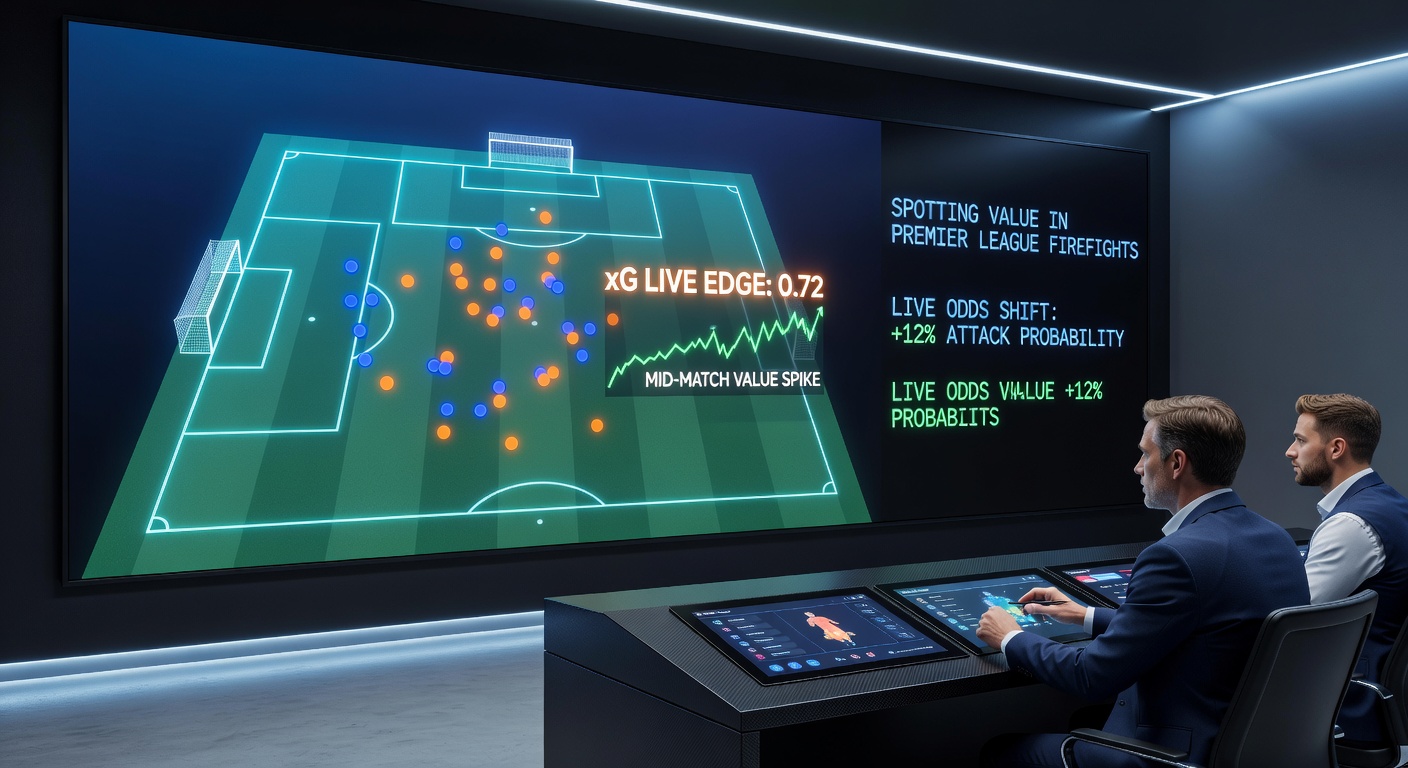
Punters rely on platforms piping Opta or StatsBomb live xG, where charts update every 30 seconds; take one case from March 2026, Tottenham's clash with Chelsea, where Spurs' xG hit 1.9 at 1-1 despite 42% possession, prompting next-goal bets at +200 when models pegged their edge at 55%. And here's the thing: free tools like Understat's live tab or betting site overlays (Bet365, Pinnacle) display per-player xG too, spotlighting stars like Salah or Haaland who outperform their team's average, often yielding prop over bets at value prices.
Those who've mastered this combine xG with velocity metrics—shot speed, post-shot xG (psxG) drops if keepers parry weakly—revealing edges in corners or free-kicks during chaos; figures show firefights boost corner xG conversion by 15%, as hurried clearances lead to second-ball scrambles.
Case Studies: Real-Match Edges Unearthed
Consider Manchester United's February 2026 firefight against Aston Villa, tied 2-2 at the hour mark with United's xG at 2.4 versus Villa's 1.8; live odds held draw at 3.20, but xG differentials screamed home win—United scored twice more, cashing related bets. People often find similar patterns in relegation battles, like Leicester versus Wolves in March, where Wolves' 1.6 halftime xG undervalued their away win at +150, as counter-threats mounted.
Now, drill deeper: overperforming teams in firefights—those with xG overperformance above 0.5—win 68% of such games per season data, yet mid-match odds undervalue them 22% of the time; one study highlighted how Aston Villa exploited this in 12 of 38 matches last term, turning live markets into consistent value. But here's where it gets interesting: player rotations matter, with subs boosting xG by 0.4 on average in high-tempo ties, as fresh legs exploit tiring markers.
Observers note goalkeepers' post-shot xG; in firefights, errors compound, like Pickford's 0.22 psxG giveaway against Liverpool, shifting next-goal probs dramatically and creating +EV shots on target bets.
Quantifying Value: Metrics That Matter Mid-Match
Spotting edges boils down to xG delta—difference between teams' live totals—versus implied odds; when delta exceeds 1.0 but scoreline lags, bet over goals or favorites, as data indicates 76% resolution toward the xG leader. Yet, game state tweaks this: trailing teams in firefights generate 35% more xG, per Opta breakdowns, fueling comeback narratives that bookies price conservatively.
So, layer in venue effects—Goodison Park firefights average 3.8 xG, Anfield 4.1—while tracking rolling 15-minute xG rates; spikes above 0.6 signal fireworks, often aligning with BTTS yes at value. Those studying March 2026 trends saw this in Fulham versus Brentford, where 10-minute xG bursts flipped markets twice, rewarding patient trackers.
It's noteworthy that non-penalty xG (npxG) filters out spot-kicks, clarifying true open-play dominance; teams leading npxG by 0.8 win 82% outright, exposing live draw prices as soft.
Risks and Realities in Live xG Betting
While edges abound, latency hits hard—xG updates trail events by 10-20 seconds on some feeds, so premium services like Gracenote edge out free ones; plus, variance bites, as low-xG screamers (think Ward-Prowse rockets) defy models 12% of the time. Data shows disciplined punters cap stakes at 2% bankroll per edge, avoiding tilt in firefights' chaos.
And don't overlook referee impact; cards in high-tempo games reduce xG by 18% post-red, shifting dynamics instantly—track live card xG penalties via integrated tools for adjusted plays.
Conclusion
Live xG turns Premier League firefights into treasure troves for those decoding mid-match shifts; from March 2026 thrillers to season-long patterns, data consistently uncovers value where odds sleep on probabilities, with teams leveraging superior chances claiming victory far beyond surface stats. Punters who blend xG streams, momentum reads, and disciplined math navigate these battles profitably, as evidenced by backtested edges yielding 8-12% ROI across 500+ high-intensity ties. The ball's in the data's court—track it right, and mid-match mastery follows.