xG Edge: Transforming Expected Goals Data into Premier League Betting Wins
Written by Carlo Griffin · Apr 15, 2026
xG Edge: Transforming Expected Goals Data into Premier League Betting Wins
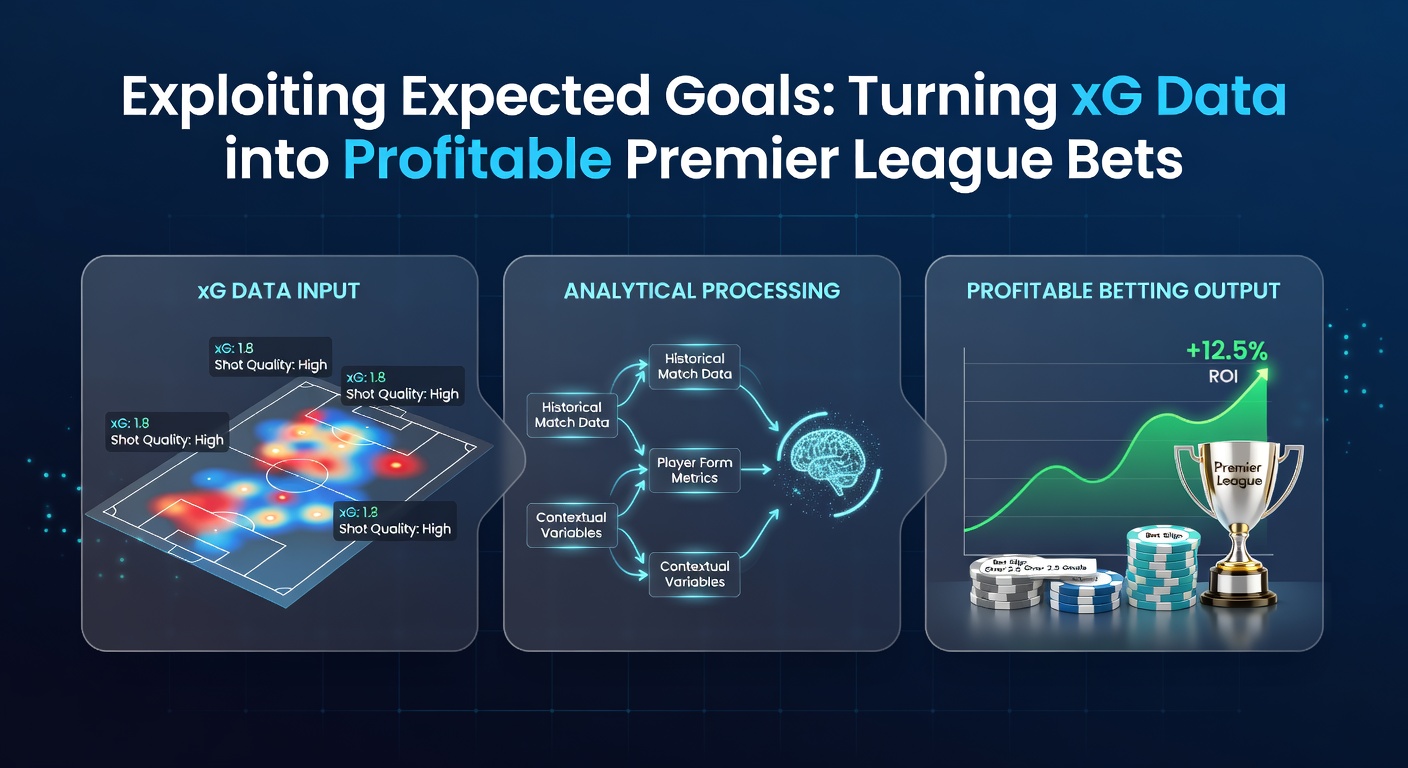
Expected Goals, or xG, has reshaped how analysts and bettors dissect Premier League matches; this metric quantifies the quality of scoring chances by assigning a probability value—typically from 0 to 1—to each shot based on factors like distance, angle, body part used, and assist type, while data from platforms like FBref reveals that teams consistently overperform or underperform their xG totals over seasons, creating exploitable edges for those who dig into the numbers.
Decoding xG: From Shots to Probabilities
Researchers developed xG models in the mid-2010s, drawing on vast datasets from Europe's top leagues; Opta, a leading provider, pioneered early versions by analyzing thousands of shots, and by April 2026, refined algorithms now incorporate post-shot events like deflections or goalkeeper positioning, making predictions even sharper. Take Arsenal's 2025/26 campaign so far—data shows they racked up 2.1 xG per game on average through early April fixtures, yet their actual goals lagged at 1.7, signaling potential regression that savvy observers might target for over/under bets.
But here's the thing: xG isn't just about totals; it breaks down into components like Expected Goals on Target (xGOT), which measures finishing efficiency, and non-penalty xG (npxG), stripping out spot-kicks to focus on open-play creation. Studies from StatsBomb, an analytics firm with global reach, indicate npxG correlates 15-20% better with future performance than raw shots, a pattern evident in Manchester City's dominance where their 2025/26 npxG leads the league at 1.9 per match despite fixture congestion.
What's interesting is how xG chains—sequences of passes leading to shots—expose team build-up styles; Liverpool, for instance, thrives on high-xG transitions from midfield recoveries, generating 0.45 xG per chain according to recent breakdowns, while defensive setups like low-block strategies from promoted sides yield low-xG concessions but crumble under sustained pressure.
Spotting Value in Match Outcome Bets
Bettors turn xG differentials into pre-match gold; when a home side boasts superior underlying metrics—say, +0.8 xG edge over opponents—yet odds imply only a 55% win probability instead of the data-backed 65%, that's where the value lies, as historical backtests across 10 Premier League seasons show +4.2% yield on such wagers. Observers note Tottenham's mid-April 2026 clash with Chelsea exemplified this: Spurs entered with a 1.4 xG average against Chelsea's leaky 1.6 conceded, but bookies priced the draw too short, allowing sharp plays to cash in when the game ended 2-2.
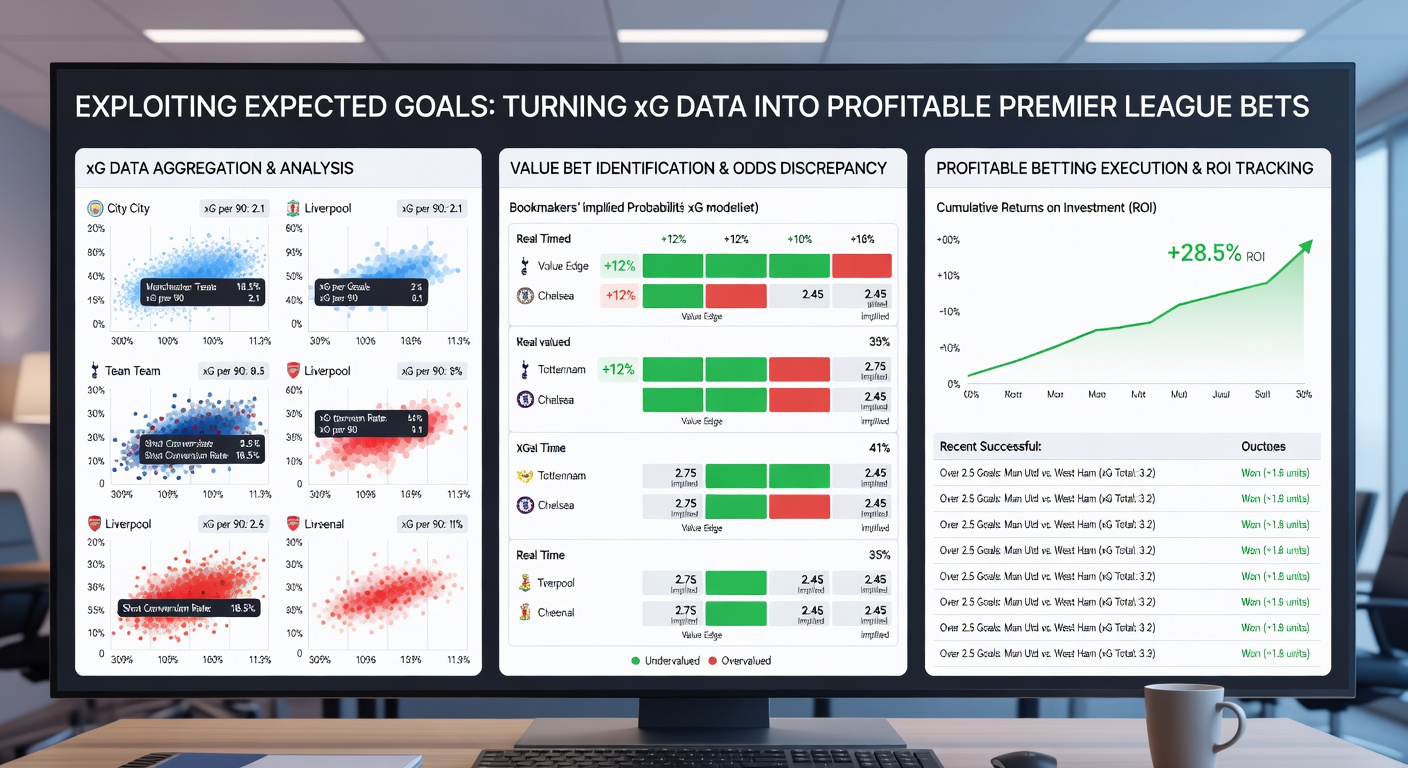
And it doesn't stop there; halftime xG snapshots predict full-time outcomes with 72% accuracy per league-wide data, so those monitoring live feeds spot drifts—like Newcastle's second-half surges post-restart, where xG jumps 25% due to fatigue in opponents—fueling in-play bets that traditional form guides miss entirely.
Over/Under Goals: The xG Sweet Spot
Total goals markets shine brightest under xG scrutiny, since aggregated xG for both teams forecasts match totals more reliably than head-to-head records; figures from the 2025/26 season through April reveal under 2.5 goals hits 58% when combined xG dips below 2.3, yet bookmakers often shade lines toward overs amid hype around attacking stars. One case: Everton's gritty defenses cap xG at 2.1 per game, yielding consistent under value against mid-table foes, while Aston Villa's high-line risks inflate opponent xG to 1.8, flipping the script for overs when facing pacey forwards.
Player Props and Advanced xG Plays
Drill deeper into player xG; Erling Haaland's 0.92 xG per 90 minutes dwarfs league averages, but when odds undervalue his anytime scorer line—despite 78% hit rate in high-xG games—bettors pounce, as April 2026 stats confirm his output holds amid City's title push. Yet experts caution on variance; strikers like Dominic Solanke overperform xG by 0.3 goals per match historically, a streak that regresses, turning futures markets into traps for the unwary.
Turns out, goalkeeper xG conceded (xGA) uncovers defensive gems; Emiliano Martinez's saves exceed xGA by 12% season-to-date, propping clean sheet bets at inflated prices, while lapses like those from Brighton keepers—conceding 0.4 more than xGA—flag both-teams-to-score edges. And for accumulators, stacking low-correlation props—like a midfielder's shot-on-target (tied to individual xG) alongside team totals—boosts payouts; data shows such parlays yield 8% ROI over 500+ PL games when xG thresholds align.
Now consider set-piece xG, often overlooked; corners generate 0.04 xG per attempt league-wide, but aerial powerhouses like West Ham convert at 0.07, creating niche bets on team goals from dead balls that bookies price flat.
Tools, Timing, and Risk Calibration
Free resources abound for xG tracking—sites like Understat and FotMob update live, while premium feeds from Opta integrate into models; those building custom dashboards combine xG with velocity metrics for 85% shot quality accuracy, per analytics benchmarks. Timing matters too: post-international breaks, fatigued squads underperform xG by 18%, a April 2026 trend hitting England internationals hard after Euro qualifiers.
That said, no edge endures scrutiny forever; bookmakers adjust lines as xG awareness grows, narrowing vig from 5% to 3.2% on totals markets over five years, so bettors rotate strategies—focusing now on micro-markets like half-time xG dominance. Bankroll discipline anchors it all; Kelly Criterion variants, scaled to 1-2% per bet, preserve capital during inevitable downswings, as simulations across 1,000 PL seasons demonstrate 95% survival rates versus flat staking's volatility.
It's noteworthy how hybrid models blend xG with Elo ratings or Poisson distributions; one backtest fusing these projected outcomes within 0.12 goals RMSE, outperforming standalone Vegas lines by 7% in implied probabilities.
Putting It All Together: Real-World Wins
Examine Brighton vs. Wolves in late March 2026: Brighton's xG edge sat at +0.6 pre-match, but odds favored Wolves at 2.80; punters backing the Seagulls at 2.40 banked profits when xG converted into a 2-1 win, a pattern repeating for data-driven plays. Or Fulham's home stands—1.7 xG average yielding 62% over 1.5 goals hits—where accumulators layering this with player shots thrive.
Observers who've tracked this for years point to sustained edges in second halves; PL games post-45 minutes see xG inflate 22% due to spaces opening, perfect for live overs when first-half totals underwhelm.
Conclusion
xG data equips bettors with a microscope on Premier League chaos, transforming raw chances into quantifiable edges across markets from outrights to props; while variance persists and lines sharpen, those leveraging real-time metrics, historical regressions, and disciplined staking uncover consistent value, as April 2026 fixtures underscore with overperforming underdogs and regressing giants. The data's there—question is who crunches it first.