Refining Stake Allocation Through Detailed Fixture Overlap Mapping in Multi-Competition Schedules
Written by Mara Wagner · Jul 17, 2026

Refining Stake Allocation Through Detailed Fixture Overlap Mapping in Multi-Competition Schedules
Fixture overlaps arise when teams compete in domestic leagues alongside European cups, international tournaments, and cup competitions that share the same weeks, and analysts track these patterns to adjust stake sizes accordingly. Data from scheduling bodies reveals that top European clubs often face three matches within eight days during congested periods, which alters player availability and performance metrics that bettors rely upon for allocation decisions.
Understanding Overlap Patterns in Annual Calendars
Calendars from organizations such as UEFA and FIFA place league fixtures next to midweek continental ties, while national team windows create further clusters every March, June, September, and November, and observers note that these intersections increase sharply when a World Cup year follows a European Championship. In July 2026 preparations for the expanded tournament in North America already show early pre-season friendlies colliding with domestic cup qualifiers in several leagues, which forces early adjustments to allocation models.
Researchers at academic institutions compile season-long grids that mark each date where multiple competitions claim the same squad, and these grids highlight clusters around Christmas, Easter, and late April when title races coincide with cup finals. One study published by a Canadian sports analytics group demonstrated that overlap density rises by 18 percent in seasons that include an extra international break, providing a measurable input for stake refinement formulas.
Methods for Mapping and Quantifying Overlaps
Analysts import official fixture lists into spreadsheet tools or custom scripts that flag shared dates, then layer in travel distances and recovery windows published by league medical panels. Color-coded heat maps emerge from this process, with red zones indicating three or more competitions within ten days, and green zones showing isolated league matches that allow fuller squad rotation. These visual layers help isolate periods where stake percentages should contract because injury risk data from previous seasons spikes in those same windows.
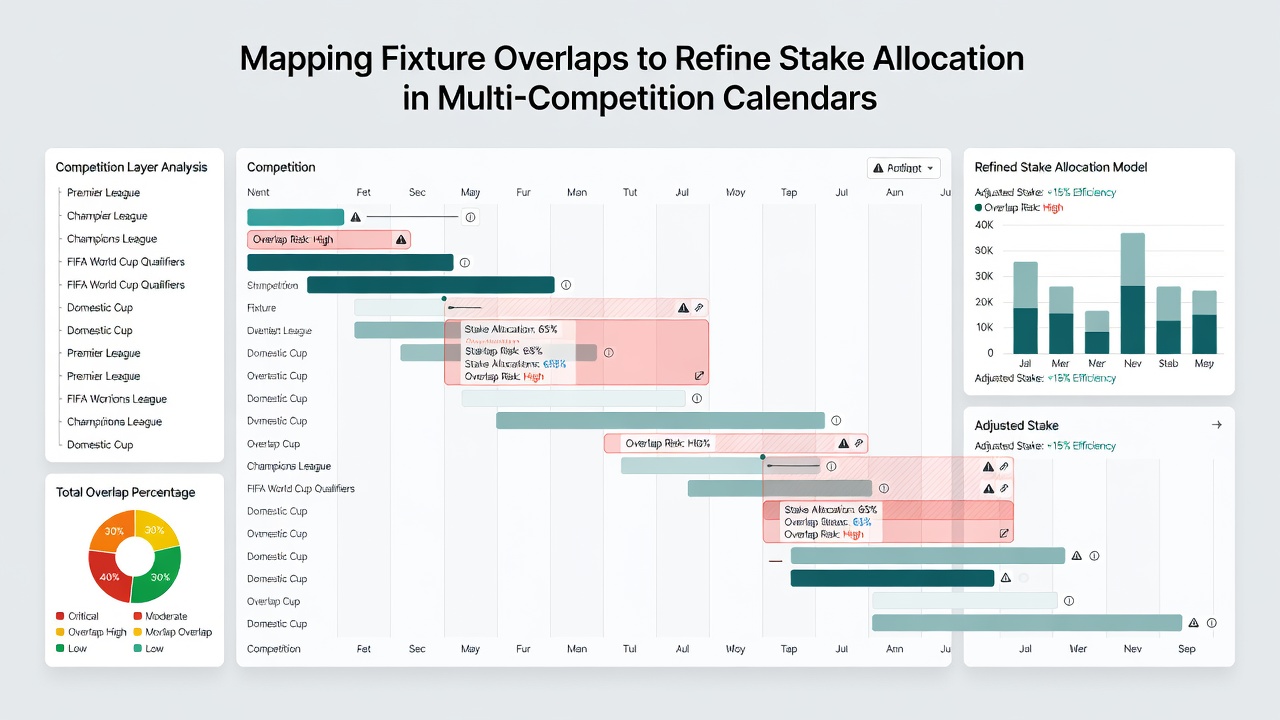
Automated scripts pull data from multiple governing bodies at once, cross-referencing start times and venue changes that occur after initial publication, and the resulting reports update weekly so that allocation percentages reflect the latest postponements. Those who maintain such systems report that manual review still catches edge cases such as replays or weather-related shifts that automated feeds miss.
Adjusting Stake Percentages Based on Overlap Data
Allocation models reduce exposure on matches that fall inside red-zone clusters because historical goal and corner averages shift when squads rotate heavily, and they increase stakes on isolated fixtures where full-strength lineups appear more likely. Figures from European club performance databases indicate that teams playing their third match in eight days score 0.4 fewer goals per game on average, supplying a concrete multiplier for expected-value calculations.
Bankroll managers apply a sliding scale where each additional overlapping competition deducts a fixed percentage from the base stake, and they recalibrate the scale after each transfer window because new squad depth changes the rotation threshold. Case records from several professional syndicates show that this overlap-adjusted approach maintained steadier monthly returns across two seasons compared with static percentage models.
Integration with Broader Calendar Analysis
Stake refinement extends beyond single-team overlaps to consider league-wide congestion that affects referee assignments and broadcast schedules, both of which influence betting market liquidity. When multiple high-profile fixtures collide, bookmaker limits tighten and odds movement slows, prompting some operators to widen margins on correlated markets. Mapping tools therefore incorporate league-wide overlap counts to anticipate these liquidity effects and to time stake placement before markets compress.
External reports from the Australian Sports Commission on scheduling impacts further illustrate how domestic and continental calendars interact across hemispheres, offering comparative data points that European-focused models sometimes overlook. Cross-referencing these sources allows analysts to test whether overlap thresholds derived in one region hold when applied elsewhere.
Conclusion
Mapping fixture overlaps supplies a structured input layer that refines stake allocation across multi-competition calendars by quantifying congestion, recovery demands, and market liquidity shifts. Organizations that maintain updated grids and integrate them with performance databases achieve more consistent exposure management, and the approach scales as additional international windows enter future seasons. Continued refinement of these methods depends on timely data releases from governing bodies and on the accuracy of automated detection scripts that flag changes after initial publication.