Referee Rosters Shape Card Betting Markets Through Assignment Patterns
Written by Quinn Krause · Jun 10, 2026

Referee Rosters Shape Card Betting Markets Through Assignment Patterns
Referee assignments in top football leagues follow structured rotation systems that create measurable patterns in card issuance rates, and analysts track these schedules to locate value in over-under card markets as well as both-teams-to-receive-a-card propositions. Data from European leagues shows consistent differences between officials based on their historical averages for yellow cards per game, fouls called, and tendency to issue reds in high-pressure fixtures, while assignment bodies publish weekly lists that allow bettors to cross-reference upcoming matches with those profiles. Observers note that leagues such as the Bundesliga and Serie A publish referee appointments several days in advance, which gives market participants time to adjust lines before odds settle around expected disciplinary volume.
Core Data Sources Behind Assignment Analysis
Statistical agencies compile referee-specific metrics that cover multiple seasons, and these datasets include home versus away splits along with adjustments for team styles that tend to draw more fouls. Figures from the 2025/26 campaign through June 2026 indicate certain referees average 5.8 yellow cards per match across 28 games, whereas others sit closer to 4.1, and the variance widens when those same officials handle matches involving clubs known for high pressing intensity. Researchers at institutions across the EU and North America have examined these distributions, and one study published through the European Sports Data Consortium highlighted how appointment timing correlates with travel schedules, which indirectly influences fatigue-related fouls and subsequent cards.
Betting operators adjust card totals based on these known tendencies, yet sharp market participants still find discrepancies when appointments feature referees returning from injury layoffs or those handling their first derby of the season. The reality is that assignment committees balance experience levels with geographic considerations, and that balancing act produces recurring clusters of higher or lower card counts that appear in the data season after season.
League-Specific Patterns and Rotation Effects
Premier League appointments often pair stricter officials with teams that commit fewer fouls, which compresses expected card totals, while La Liga tends to assign more lenient referees to matches between mid-table sides. Those who've tracked these rotations observe that the same official might post elevated card numbers after a two-week break compared with a run of consecutive fixtures, and the effect shows up most clearly in the first 30 minutes of matches. Data indicates away teams receive roughly 1.3 more yellow cards on average under certain referees, and this split widens further in stadiums where crowd density historically influences decision thresholds.
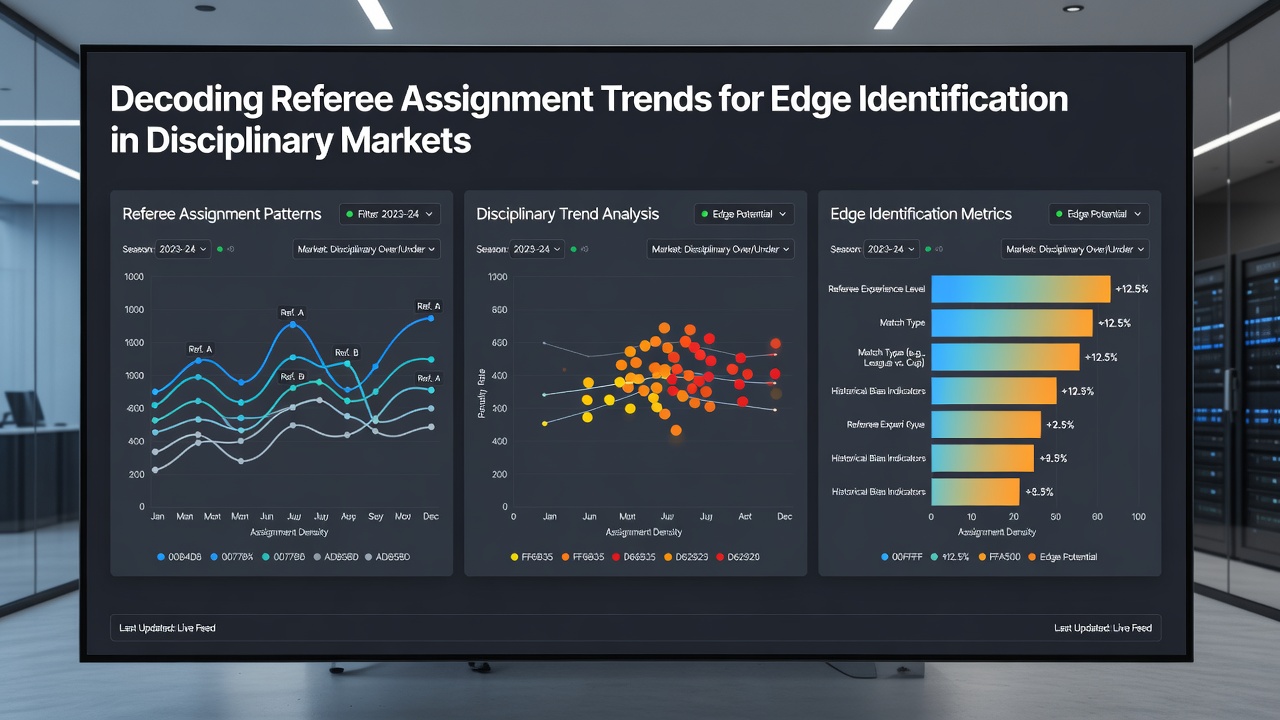
What's interesting is how mid-season schedule changes, such as those announced in late spring 2026, altered several high-profile appointments and produced measurable shifts in card volume across the final ten matchweeks. Industry reports from organizations like the International Betting Integrity Association confirm that disciplinary market liquidity increases when appointment data becomes public, yet the underlying patterns remain stable enough for systematic tracking.
Practical Application in Market Identification
Traders combine referee histories with team-level foul rates and expected match tempo to generate projected card totals, and these projections frequently diverge from closing lines when assignments favor officials with outlier profiles. Take one case where a referee averaging 6.4 cards per game received a high-stakes fixture between two possession-dominant sides, and the resulting over hit at a rate above 60 percent across comparable past matches. Observers note that similar edges appear in cup competitions where neutral-site assignments reduce home bias and increase card frequency under referees who travel frequently.
Academic papers from Canadian and Australian research groups have modeled these variables using regression techniques that control for weather, travel distance, and fixture congestion, and the outputs align closely with observed betting market movements. Those models treat referee identity as a fixed effect that interacts with team aggression metrics, which allows identification of mismatches between expected and implied probabilities in disciplinary lines.
Conclusion
Assignment trends supply a repeatable framework for evaluating disciplinary markets because the underlying data remains public and relatively stable across seasons. Market participants who integrate referee schedules with team-specific foul profiles and historical splits continue to locate discrepancies that close only after significant volume arrives. As leagues refine their rotation policies through 2026 and beyond, the same analytical approach adapts to new appointment rules while preserving the core relationship between official identity and card outcomes.