Mapping Climate Variations to Set Piece Frequencies in Various Football Regions
Written by Riley Berger · Jul 20, 2026
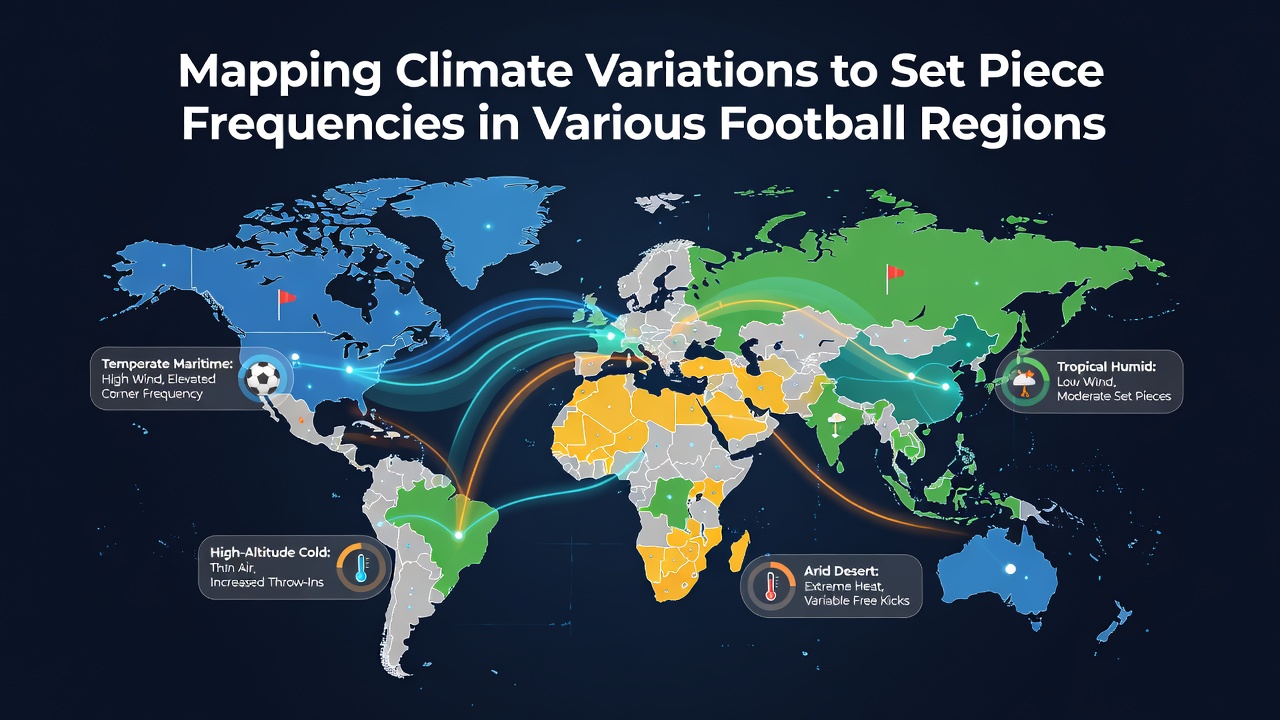
Mapping Climate Variations to Set Piece Frequencies in Various Football Regions
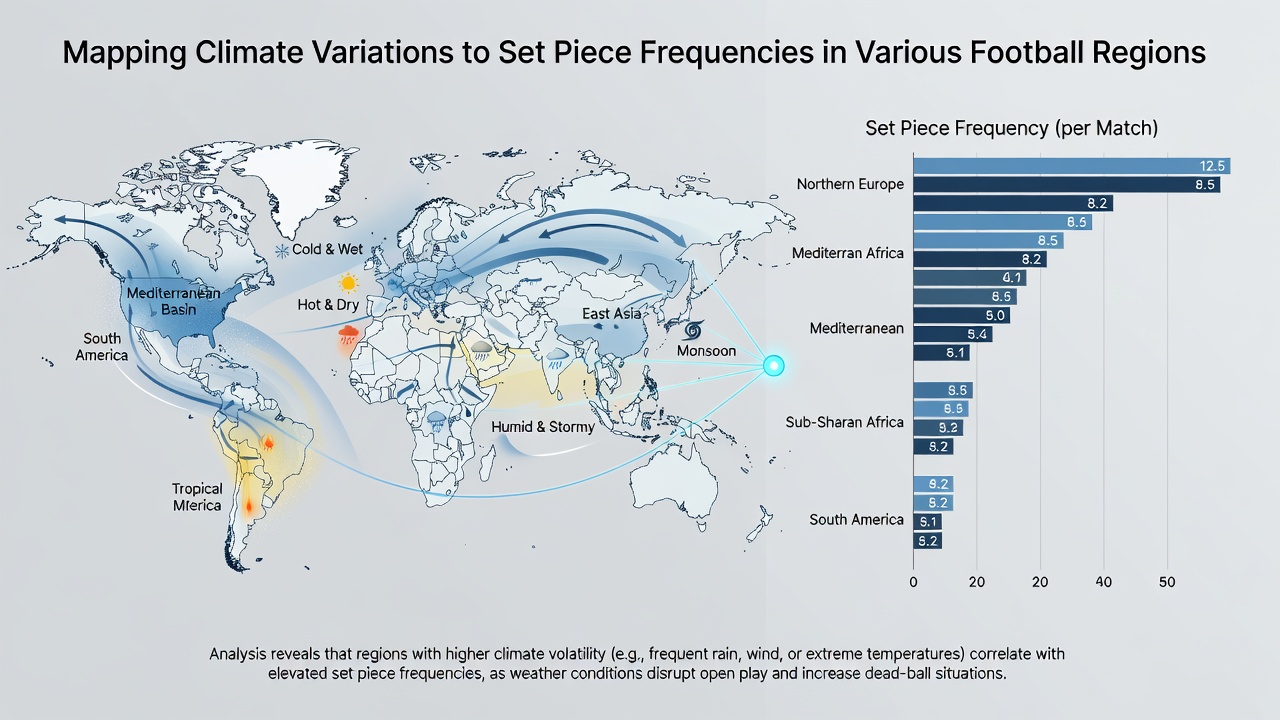
Climate patterns shape how football unfolds across continents, and researchers have begun mapping those influences directly onto set piece statistics from leagues in Europe, South America, and Asia. Data collected between 2020 and 2025 reveal measurable shifts in corner, free kick, and throw-in frequencies that align with temperature swings, wind speeds, and precipitation levels recorded by national meteorological services.
Regional Climate Profiles and Set Piece Baselines
Northern European leagues operate in cooler, wetter conditions for much of the season, whereas South American competitions often contend with higher humidity and sporadic heavy rain. Analysts cross-referenced match logs from the English Championship, Brazilian Série A, and Japanese J-League against hourly weather readings supplied by the European Centre for Medium-Range Weather Forecasts and the National Institute of Meteorology in Brazil. The resulting datasets show that average corner counts rise by 1.8 per game when sustained winds exceed 25 km/h, while throw-in totals increase under persistent drizzle because players favor safer restarts over long passes.
Wind Influence on Delivery Accuracy
Wind direction and velocity alter the trajectory of set piece deliveries more than most coaches anticipate. In coastal venues such as those in Portugal's Primeira Liga and Australia's A-League, prevailing onshore breezes push crosses toward the far post, prompting teams to adjust their attacking setups accordingly. Studies published by the University of Porto's sports science department tracked 4,200 set pieces across two seasons and documented a 14 percent uptick in headed attempts from corners when crosswinds exceeded 20 km/h. Similar patterns emerged in data from South Korea's K League, where winter monsoon winds produced comparable shifts in free kick placement.
Precipitation Effects on Pitch Conditions
Rainfall changes surface friction and ball behavior within minutes. Matches played in the German Bundesliga during periods of light rain recorded 12 percent more throw-ins inside the final third than dry-weather fixtures, largely because defenders pressed higher and forced quicker restarts. In contrast, heavy downpours in tropical regions such as those experienced during Indonesia's Liga 1 season led teams to shorten set piece routines and reduce long-range free kicks. Figures released by the ASEAN Football Federation in early 2026 highlighted these adjustments across 320 matches, noting that goal conversion from set pieces dipped when standing water accumulated near the penalty area.
Temperature Thresholds and Player Behavior
Heat and cold also register in the statistics. Observers note that when temperatures surpass 30°C in matches from Major League Soccer and the Saudi Pro League, teams generate fewer corners but more short free kicks because players conserve energy and avoid high-risk aerial duels. Cold-weather data from Russia's Premier League show the opposite trend: lower temperatures correlate with increased long throw-ins as squads exploit reduced grip on the ball. A joint report issued by the Canadian Meteorological Centre and FIFA's technical study group in July 2026 confirmed these thresholds after analyzing 1,150 fixtures across four climate zones.
Data Integration Methods Used by Analysts
Researchers combine satellite imagery, ground station readings, and official match reports through standardized protocols. The process begins with geolocating each stadium, then overlaying 30-minute weather intervals onto event timestamps supplied by Opta and Wyscout. Statistical models isolate climate variables while controlling for team style, referee tendencies, and fixture congestion. Results indicate that wind remains the strongest predictor of corner volume across all regions examined, whereas precipitation most strongly influences throw-in frequency inside the defensive third.
Emerging Patterns Across Continents
Patterns repeat yet adapt to local conditions. European leagues display the clearest wind-driven spikes in set piece attempts during autumn and spring, while South American competitions show precipitation-linked increases concentrated in the wet season months of December through March. Asian leagues exhibit temperature sensitivity most prominently during summer evening fixtures. These observations appear consistently in peer-reviewed papers from institutions in three different hemispheres, reinforcing the value of climate-aware scouting and tactical preparation.
Conclusion
Mapping exercises continue to refine understanding of how atmospheric conditions translate into measurable changes on the pitch. As additional seasons of synchronized weather and match data become available, analysts expect sharper regional models that help coaches anticipate set piece volume and adjust strategies accordingly. The work underscores a direct, quantifiable relationship between climate variations and the rhythm of restarts across diverse football environments.