Fixture Overload: Examining How Packed Schedules Shift Team Metrics and Guide Betting Decisions
Written by Mara Wagner · Jul 1, 2026
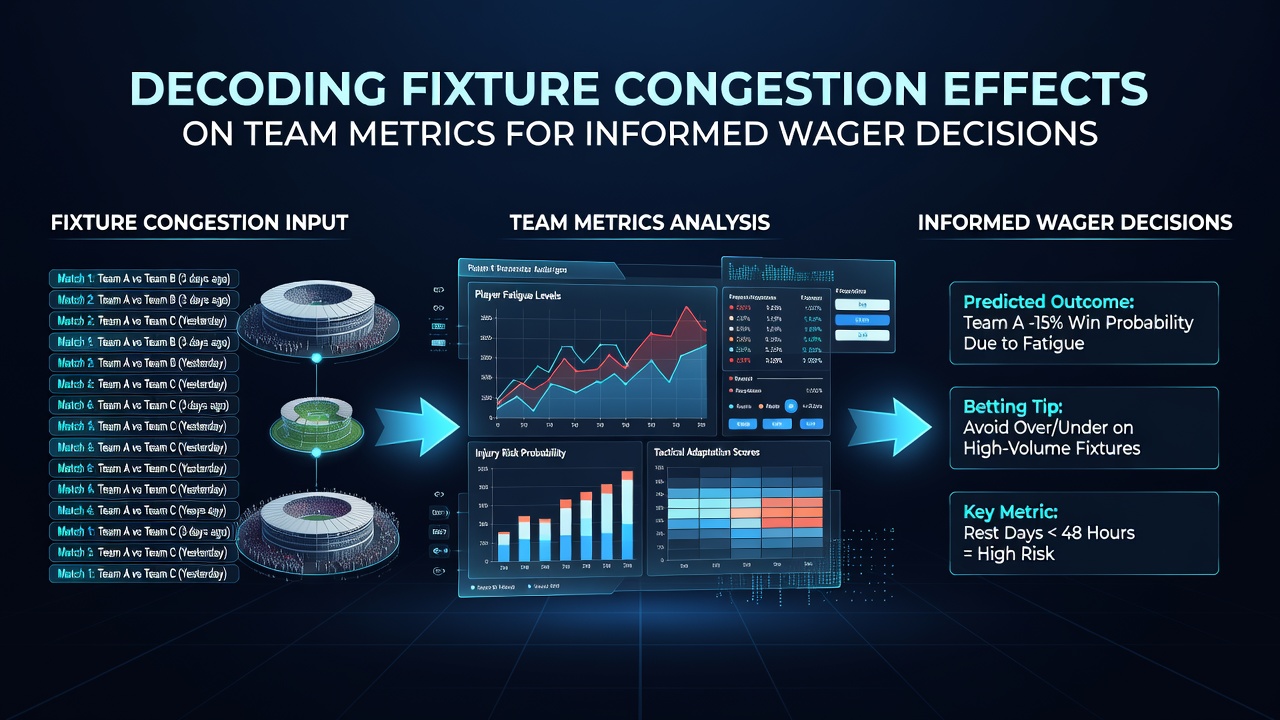
Fixture Overload: Examining How Packed Schedules Shift Team Metrics and Guide Betting Decisions
Fixture congestion arises when teams face multiple matches within short timeframes, often spanning domestic leagues, cups, and European competitions, and this pattern alters key performance indicators that bettors track closely. Observers note that clubs competing in the Premier League alongside Champions League campaigns encounter weeks with three or more fixtures, which compresses recovery periods and modifies output in areas such as distance covered, pass completion rates, and shot accuracy. Data from elite European leagues shows these shifts occur predictably during winter months and spring title races, where squads rotate personnel yet still register measurable declines in high-intensity efforts.
Core Metrics That Change Under Congestion Pressure
Team statistics evolve in distinct ways once schedules tighten, with researchers documenting reductions in total distance run per 90 minutes that average between 5 and 8 percent across congested periods according to performance tracking firms. Pass accuracy tends to dip as fatigue sets in, while defensive metrics like tackles won and interceptions per game fluctuate depending on whether managers prioritize rest or maintain pressing intensity. Those who study squad data discover that expected goals (xG) values for both attack and defense compress during such stretches, creating patterns where matches produce fewer open-play opportunities yet more set-piece situations because tired legs lead to fouls and clearances under pressure.
What's interesting is how injury rates climb once the fixture list piles up, with hamstring and muscle strains appearing at higher frequencies after three matches in eight days, and league-wide figures reveal that clubs averaging fewer than four rest days between games see squad availability drop by noticeable margins. This dynamic directly feeds into betting markets focused on total goals, corners, and cards because altered work rates change the tempo and physicality of contests.
Patterns Observed Across Recent Seasons
Take one analysis of Premier League data from 2023 through 2025 where teams involved in multiple competitions posted lower xG differentials in their fourth and fifth matches within a 14-day window compared with standard schedules. European sides that advanced deep into continental tournaments often showed dips in away form during domestic follow-up games, while home performances held steadier because familiarity with surroundings offset some fatigue effects. Observers note that set-piece conversion rates sometimes rise in congested blocks because teams rely more on structured plays rather than fluid movement, which opens value in markets centered on throw-ins, free kicks, and headed attempts.

July 2026 scheduling discussions already highlight how expanded international calendars may intensify these pressures ahead of the next campaign, with preliminary fixture lists indicating tighter turnarounds for clubs balancing league and continental duties. A study published in the Journal of Sports Sciences examined workload data across five major leagues and found that recovery markers such as heart-rate variability and GPS-tracked accelerations recover more slowly when matches occur with minimal rest, directly correlating with reduced sprint distances in subsequent outings.
Applying Metric Shifts to Wager Strategies
Betting decisions gain precision when analysts incorporate congestion-adjusted models rather than raw season averages, because historical trends show that overs on cards appear more frequently in midweek European follow-ups where referee leniency combines with tired challenges. Corners markets also respond to these conditions since teams under fatigue clear the ball more often, increasing the volume of set pieces. Those who monitor rotation news discover that sides resting key attackers often see drops in shots on target, which tilts totals markets toward unders in certain contexts while boosting value on opponent clean-sheet bets.
One research project conducted by sports scientists at the University of Sydney tracked similar patterns in Australian A-League squads facing condensed schedules and confirmed parallel reductions in high-speed running that mirrored European findings. Bettors who integrate such external benchmarks alongside domestic tracking data refine their approach to player props and team totals because individual output metrics like key passes and progressive carries decline at predictable rates once minutes accumulate without adequate recovery.
Conclusion
Fixture congestion produces consistent, measurable changes across team metrics that shape outcomes in multiple betting markets, from goal totals and cards to set-piece volume and clean-sheet probabilities. Analysts who track rest-day counts, rotation patterns, and workload indicators build more accurate forecasts than those relying solely on season-long averages, and the expanding calendar through 2026 suggests these effects will remain central to informed decision-making in football wagering.