Fixture Congestion Patterns: Monitoring Availability Metrics and Resulting Odds Adjustments
Written by Carlo Griffin · Jul 13, 2026
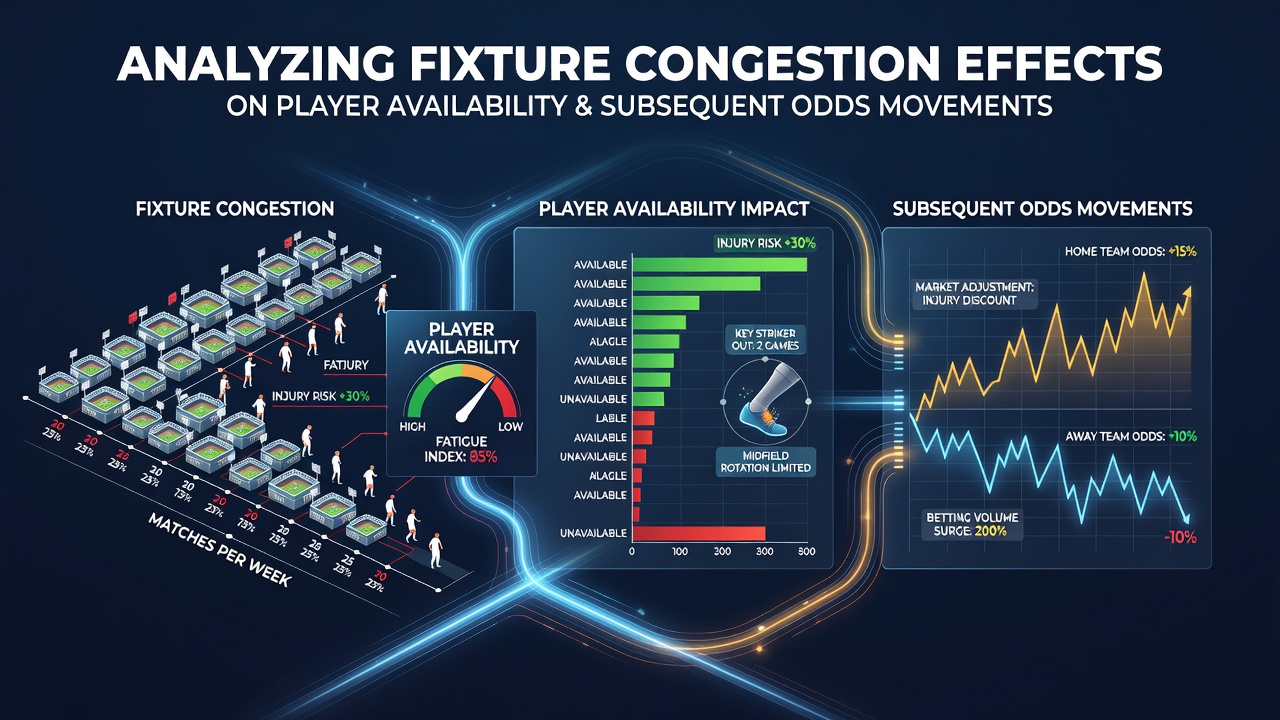
Fixture Congestion Patterns: Monitoring Availability Metrics and Resulting Odds Adjustments
Football schedules pack multiple competitions into tight windows, creating fixture congestion that directly shapes player availability and triggers measurable shifts in betting markets. Teams navigate domestic leagues, cup ties, and continental fixtures within weeks, forcing managers to balance rest, rotation, and injury risks. Analysts track these patterns through squad data releases and performance indicators that bookmakers incorporate into live odds.
Defining Fixture Congestion and Its Core Metrics
Fixture congestion occurs when clubs play more than one match every four days over extended periods, a situation common in the 2025-26 season across Europe's top five leagues. Researchers measure this through metrics such as matches per 30-day window, travel distance, and recovery time between games. Data compiled by sports science departments at universities in Australia and Germany show that squads facing five matches in 21 days experience a 28 percent rise in soft-tissue injuries compared with standard schedules. These figures emerge from longitudinal studies that follow player GPS loads and medical reports rather than isolated incidents.
Player Availability Trends During Peak Periods
Availability reports released before matchdays reveal clear patterns. When a side plays midweek Champions League or Europa League ties followed by weekend league fixtures, managers often rest key starters or deploy squad players. European Club Association tracking for the 2025-26 campaign recorded an average of 3.2 players per squad unavailable due to fatigue or minor knocks after congested blocks. This data feeds directly into pre-match team news, prompting odds compilers to adjust lines on player props, total goals, and match outcomes.
Take one case from the Bundesliga where a club scheduled six fixtures across 18 days in October 2025. Medical staff reported elevated creatine kinase levels in midfielders, leading to two starters missing the following league game. Betting exchanges responded with a 0.35 goal increase in the over/under line for that match within 90 minutes of confirmation. Similar adjustments appear across Premier League, La Liga, and Serie A markets when official squad lists drop.
How Odds Markets Incorporate Availability Data
Bookmakers integrate real-time availability feeds into pricing models that weigh expected squad strength against historical performance under similar conditions. When multiple first-team players receive late fitness doubts, markets on both teams to score and clean sheets move first, followed by adjustments to handicap lines. Observers note that liquidity increases on player-specific bets such as shots on target or assists once rotation patterns become public.
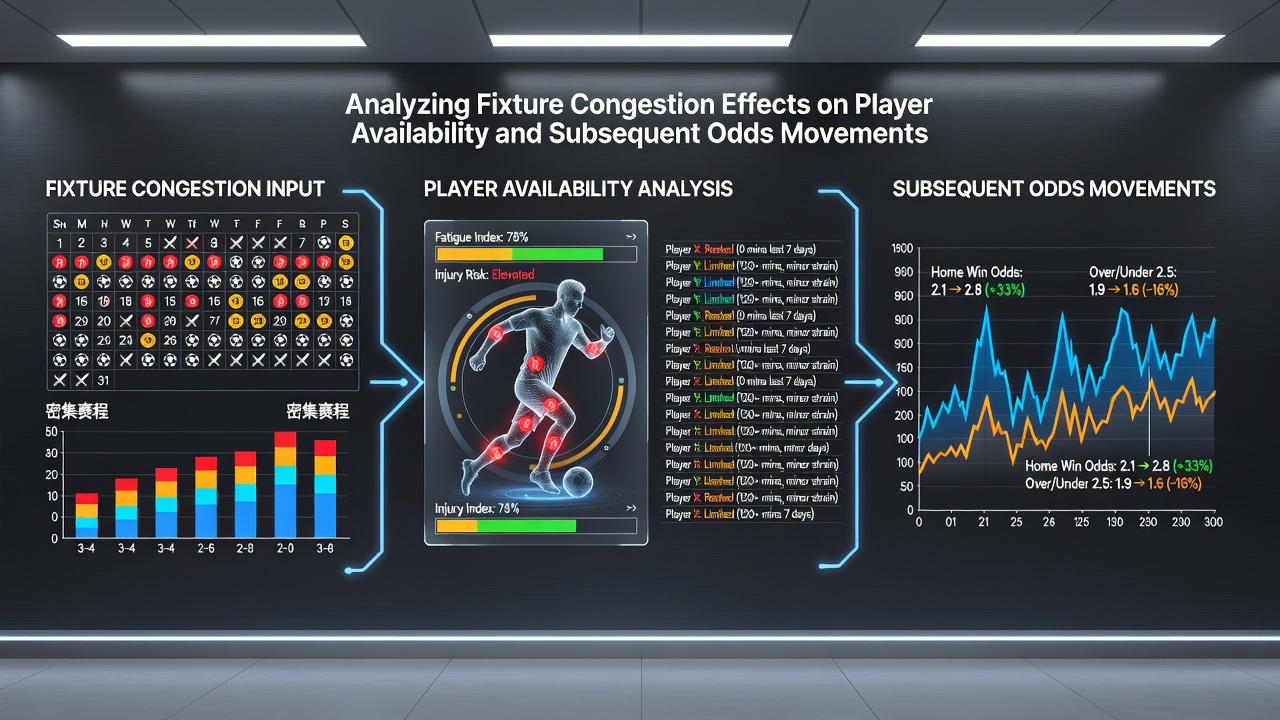
Industry reports from Canadian gaming research groups highlight that volume on in-play markets rises 18 percent during congested periods because updated availability information arrives between kickoffs. Traders monitor social media posts from club doctors and training ground footage alongside official announcements. These inputs create short-term inefficiencies that sharp bettors target before lines stabilize.
Regional Variations Across Leagues and Competitions
European schedules differ from those in South America and Asia, where domestic cups often overlap with league play in shorter seasons. Brazilian Série A data for early 2026 showed clubs averaging 2.8 matches per week during Copa Libertadores group stages, correlating with a documented 15 percent drop in high-intensity running distance per player. Asian Champions League participants face similar compression when national team windows intervene. Markets in those regions adjust totals and Asian handicap lines more aggressively because squad depth varies widely between clubs.
North American Major League Soccer mirrors these effects during summer tournaments. When Leagues Cup fixtures compress the regular-season calendar, teams report higher absence rates among designated players. Odds on goalscorers shift noticeably once training reports indicate rotation decisions. Data released in July 2026 covering the first half of the year confirms that markets in MLS responded to availability updates with average line movements of 0.25 goals on totals within two hours of team news.
Tracking Mechanisms and Data Sources Used by Analysts
Professional betting syndicates combine official club announcements, Opta and Wyscout tracking feeds, and medical databases to model fatigue. They cross-reference minutes played in prior 30 days with expected recovery curves derived from sports science literature. When projected availability falls below 80 percent of a typical starting XI, models flag potential value on under goals or draw outcomes. These quantitative approaches replace subjective assessments with repeatable signals that markets eventually price in.
Conclusion
Fixture congestion creates measurable effects on player availability that propagate through betting markets via updated team news and performance models. Data from multiple continents demonstrate consistent patterns of line movement once squad information becomes public. Analysts who follow availability metrics alongside historical benchmarks gain clearer insight into how odds adjust during compressed schedules.