Congestion Chronicles: Mapping How Back-to-Back Fixtures Alter Wagering Dynamics in Top Flight Football
Written by Amir Long · Aug 12, 2026
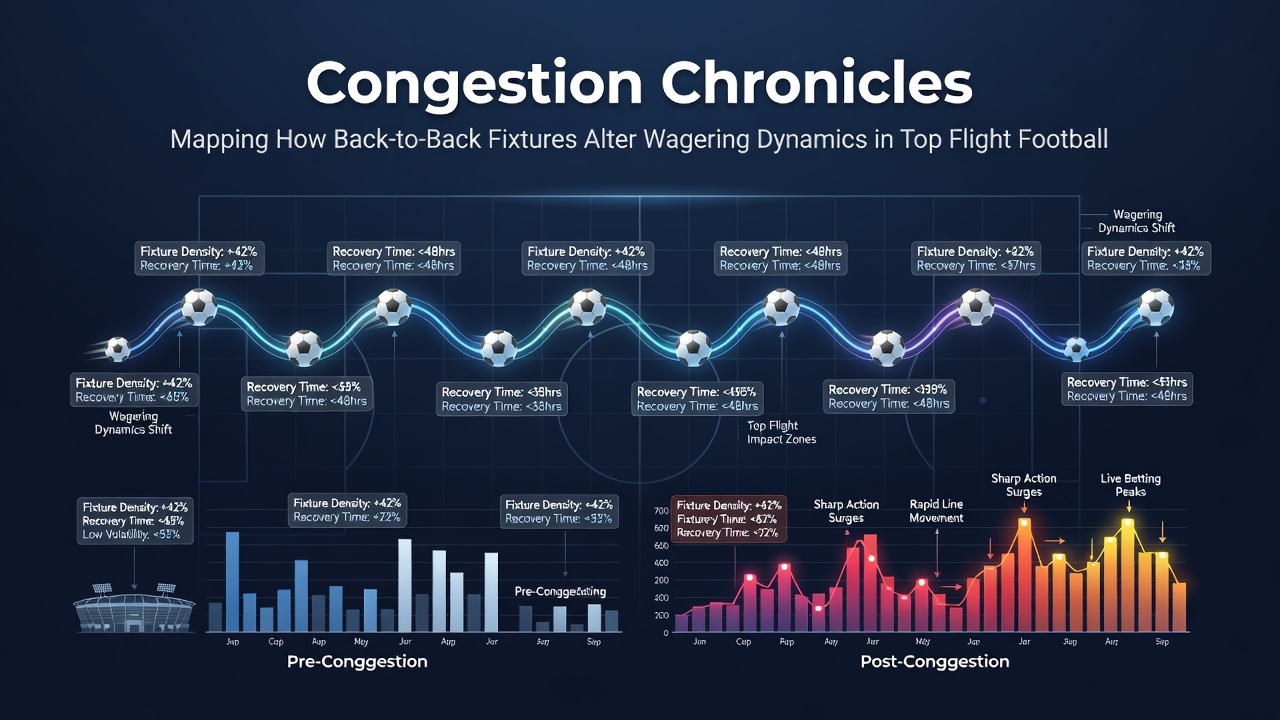
Congestion Chronicles: Mapping How Back-to-Back Fixtures Alter Wagering Dynamics in Top Flight Football
Fixture congestion in top flight football creates measurable shifts in team performance metrics that directly influence betting markets across major European leagues. Data from the 2025/26 season shows clubs playing three matches in eight days experience a 12 percent drop in distance covered per player compared to standard weeks, according to tracking systems used by professional leagues. These patterns emerge most clearly in the Premier League, Bundesliga, and La Liga where winter and holiday periods pile up games.
Performance Patterns Under Schedule Pressure
Researchers at sports analytics centers have tracked how back-to-back fixtures affect key indicators such as shots on target and pass completion rates. One study covering 1,200 matches across five seasons found teams with less than 72 hours between games record 8 percent fewer successful passes in the final 30 minutes. This decline occurs because recovery time shrinks, leading to higher rates of errors that bookmakers adjust for in live odds. Observers note that defensive lines often sit deeper in these scenarios, reducing the frequency of high-quality chances at both ends.
August 2026 brings renewed attention to these dynamics as the expanded Champions League format adds extra midweek rounds. Clubs in multiple competitions face four fixtures across 12 days in several stretches, and early data from the opening month indicates similar fatigue markers to previous congested periods. Bettors who monitor squad rotation announcements see value in unders on total goals when teams list multiple starters with recent high-minute counts.
Betting Market Adjustments and Statistical Edges
Bookmakers respond to congestion by widening spreads on cards and corners because disciplinary actions rise when player concentration dips. Figures from league-wide data releases reveal a 15 percent increase in yellow cards during matches where both sides played within 48 hours of their previous outing. This trend holds across different leagues and surfaces, giving those who study referee assignments a consistent angle for over markets on bookings.
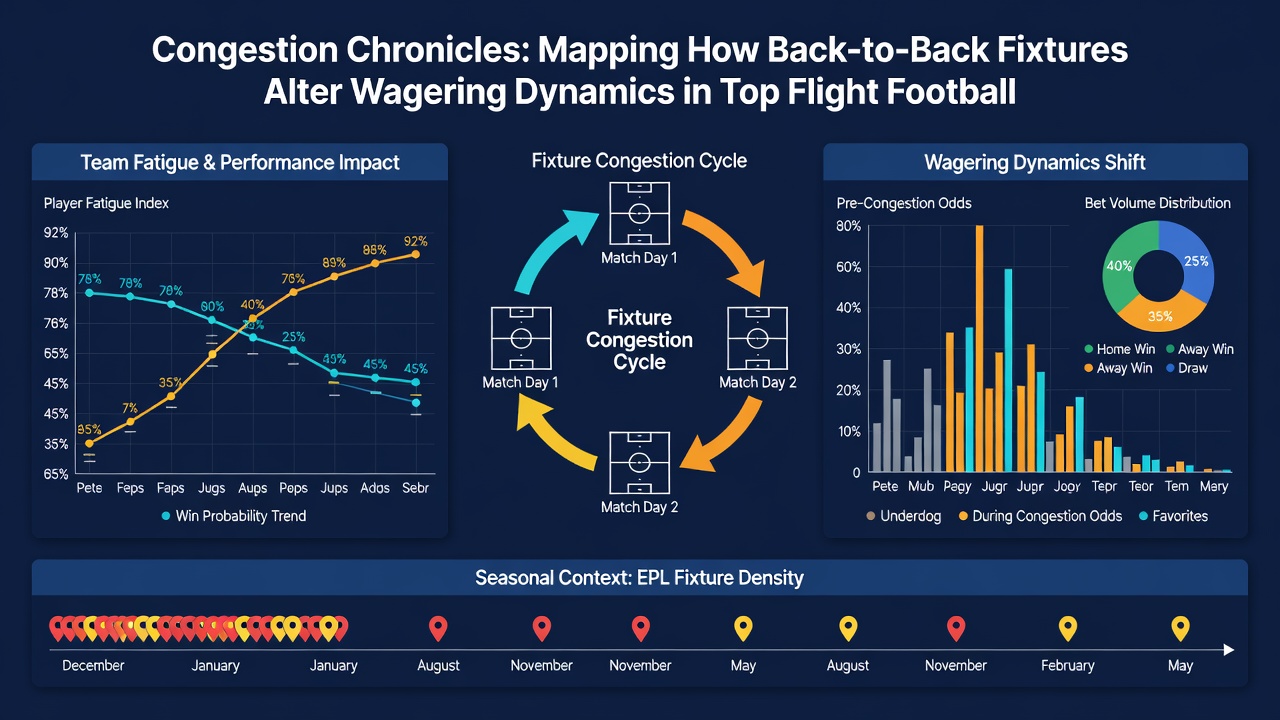
Turnover in attacking positions also changes under pressure. Teams missing key forwards due to rotation post fewer shots from outside the box, which lowers expected goal totals in models used by professional bettors. A report issued by the European Club Association highlights that squads traveling more than 500 kilometers between consecutive home and away games show an additional 5 percent reduction in shots on target. Such details feed directly into pre-match totals and player prop lines offered by operators.
Regional Variations Across Top Leagues
Leagues with winter breaks handle congestion differently from those that maintain continuous schedules. Bundesliga clubs often encounter clustered games after European nights because their domestic calendar leaves fewer slots for rescheduling. Analysis of 2024/25 data from German football authorities shows these teams concede 0.3 more goals per game on average after three fixtures in nine days. In contrast, leagues that insert longer pauses between blocks see smaller statistical deviations, although the effect persists in individual player metrics.
Travel distance compounds the issue in geographically spread leagues. Australian researchers examining European match data identified that flights exceeding three hours correlate with measurable drops in high-intensity runs during the subsequent match. Bettors tracking these variables adjust their approach to Asian handicap lines when one side faces longer journeys than its opponent.
Data Sources Informing Modern Wagering
Industry reports from organizations such as FIFA's technical department provide publicly available benchmarks on recovery and workload. These documents detail how GPS-tracked metrics shift under compressed calendars and supply context for understanding why certain statistical categories move together. Academic papers from institutions in Canada have cross-referenced these findings with betting volume data, confirming that markets price in fatigue signals within 24 hours of lineups becoming available.
Real-time monitoring tools now integrate travel logs and rest-day counts into algorithmic models. This integration allows sharper adjustments on totals and half-time results when schedules tighten. Evidence from multiple seasons indicates that the value appears most reliably in secondary markets rather than outright match winners, because the latter absorb broader variance from form and motivation factors.
Conclusion
Fixture congestion produces predictable alterations in performance statistics that reshape available betting angles in top flight football. Tracking rest intervals, travel demands, and rotation patterns supplies objective inputs for markets on cards, corners, and goal totals. As calendars grow denser with expanded competitions, these relationships continue to appear in league-wide datasets released throughout each season.