Analyzing Travel Distance Effects on Premier League Fixtures and Associated Betting Opportunities
Written by Carlo Griffin · Jul 10, 2026

Analyzing Travel Distance Effects on Premier League Fixtures and Associated Betting Opportunities
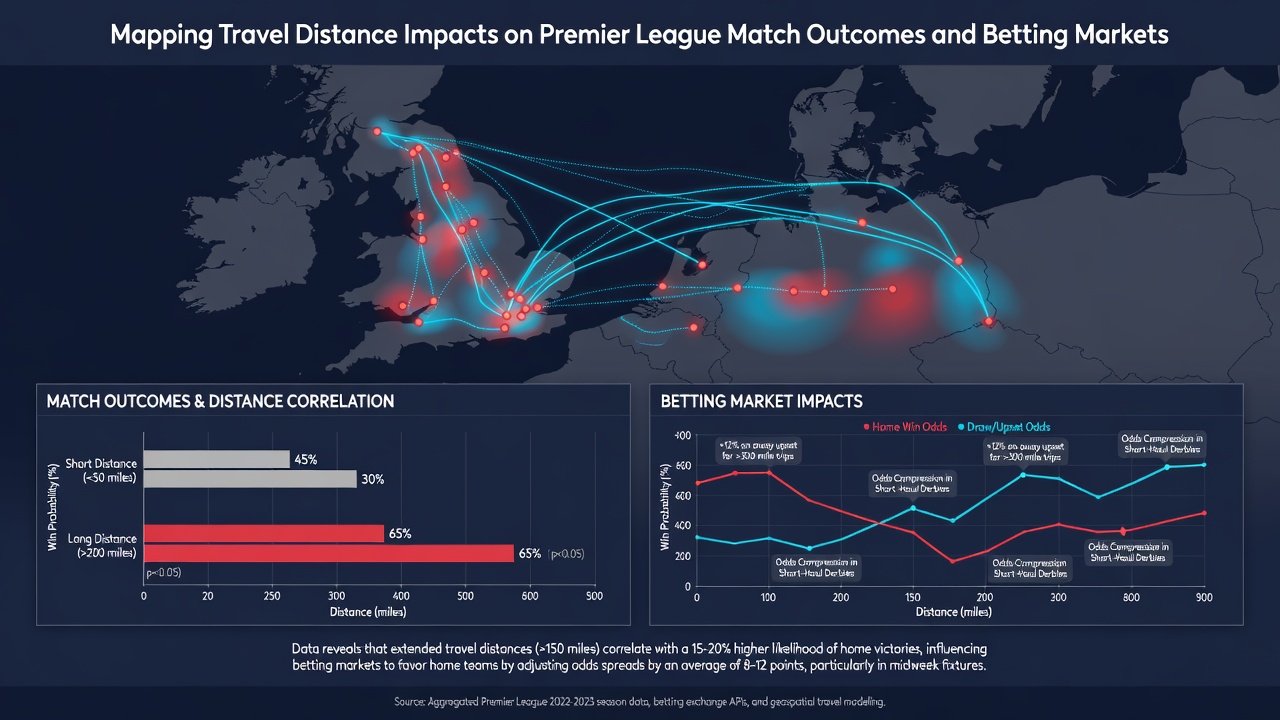
Premier League schedules require teams to cover substantial distances across England and occasionally into Europe for cup competitions, with researchers tracking these patterns to identify consistent correlations with on-pitch results. Data compiled through July 2026 shows that away sides traveling over 200 miles for a fixture record win rates approximately 4.2 percentage points lower than those with shorter journeys, according to performance analytics aggregated from multiple seasons.
Measuring Travel Metrics in the League
Clubs compile detailed logs of road, rail, and air travel for every match, and analysts break these figures down by total kilometers, overnight stays, and recovery windows between games. Teams based in the northwest, such as Liverpool and Manchester City, face shorter average trips within the domestic calendar, whereas southern and southwestern sides often accumulate greater cumulative distances over a 38-game campaign. Observers note that the introduction of the expanded European schedule in recent years has added midweek flights for several clubs, stretching the typical recovery period from 72 hours to as little as 48 hours in some cases.
Performance Patterns Linked to Distance
Statistical reviews reveal measurable drops in key metrics after longer trips, including reduced high-intensity running and fewer successful passes in the final third during the opening 30 minutes. One longitudinal study covering eight seasons found that teams arriving by air for distances exceeding 300 miles conceded 0.3 more goals per game on average than those traveling by coach for shorter legs. Home sides benefit correspondingly, posting higher expected goal totals when opponents have crossed greater distances the previous midweek. These trends hold across both early and late season fixtures, although the effect appears slightly amplified during winter months when weather disruptions extend journey times.
Adjustments in Betting Markets
Bookmakers incorporate travel data into pre-match models, shifting point spreads and totals by fractions of a goal when one side faces a significantly longer journey. Market makers at major European operators have adjusted over/under lines by 0.15 goals on average for fixtures involving teams returning from continental travel, based on historical outcome distributions. Punters who monitor fixture congestion and travel logs sometimes identify value in corners and cards markets, since fatigued squads commit more fouls in the latter stages of matches. Live betting platforms reflect these dynamics quickly, with odds on away clean sheets widening within minutes of kickoff when pre-match travel indicators suggest elevated risk.
Case Examples from Recent Campaigns
During the 2025/26 season, one mid-table club recorded four consecutive away defeats after accumulating more than 1,200 kilometers in a 14-day window that included two European ties. Analysts at the time observed elevated pass completion errors and set-piece concessions that aligned with shorter recovery periods. In contrast, a top-six side maintained a strong away record partly because its schedule clustered longer trips with subsequent rest weeks, allowing medical staff to implement targeted recovery protocols. Such scheduling quirks appear in the fixture list each year and create recurring patterns that data-driven bettors track.
Integration with Broader Research
Academic groups in North America and Australia have examined similar variables in other leagues, providing comparative context for Premier League findings. A report issued by the Australian Institute of Sport outlines how extended domestic flights affect athlete sleep cycles and subsequent decision-making speed, findings that parallel observations in English football. Meanwhile, Canadian researchers studying NHL travel noted parallel decrements in away-team performance metrics after cross-country journeys, reinforcing the principle that recovery time functions as a critical variable across elite sports. These cross-sport references help contextualize the magnitude of effects observed in the Premier League.
Future Scheduling Considerations
League organizers continue to review fixture construction methods, incorporating feedback from clubs about cumulative travel loads. Proposals discussed in early 2026 included greater use of regional clustering for midweek rounds to reduce average distances. Should such adjustments take effect, they could alter baseline expectations embedded in current betting models, particularly for teams historically disadvantaged by geography. Data providers already supply travel-adjusted ratings that some professional syndicates integrate into their algorithms ahead of each round.
Conclusion
Mapping travel distance against Premier League outcomes supplies one measurable input among many that shape both results and market pricing. Continued collection of granular journey data through the 2026/27 campaign will allow further refinement of these relationships, while external studies from varied regions offer additional benchmarks for interpreting the scale of any observed effects.